1.One Single Green Bar and One Single Red
Bar Trading Method:
Hello Friends, This is one of my favorite trading
method in which we just concentrate on one single
red bar to buy and one single green bar to sell.
Actually Candlestick Chart is one of the best way
to analyze the market with price action, There are
so many popular candlesticks which can make it
easier for you to understand the next movement of
the market price in future. Now I would like to
discuss that what is actually the meaning of one
single red bar and one single green bar in this
trading concept.
(a).ONE SINGLE RED BAR BUY SIGNAL:
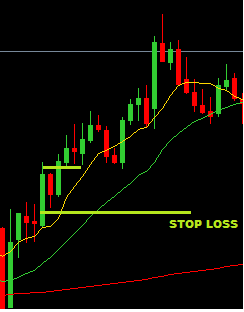
So Guys this is one Single Red Bar trading
method where we have to just focus on the
red candle after few greens or one single green
here its important to know in this style that
market should be above of 200 Simple
Moving Average(SMA) Indicator. If you
are looking for the scalping then your risk
Risk & Reward will be 1:1 and if you are looking
for more profit then you can look forward to use a
risk & reward of 1:3 and more. Personally I am using
this style in 5 minute chart time frame but if you
are a long term trader then this strategy can be best
in h4 and daily chart time frame also.The stop loss
will be used below of our red candle as shown in
image above.
(b).ONE SINGLE GREEN BAR BUY SIGNAL:
One Single Green bar method is best for the selling
time its a strategy which is suitable for selling market
when there is a bearish trend running in stock market.
Here market should be below of 200 SMA

and One single Green Bar should be cut down from one
single Red bar in this method. The risk and reward will
be same 1:1 in scalping and in long term trading method
we can concentrate on 1:3,1:4 and so on. Here Stop loss
Above of Green Bar, or we can adjust that according to
our risk and reward setting.
2.Technical Analysis & 3 Scalping: We have already
discussed about these methods in our Other app
You can download that app direct from Google Play
Console account named Day Trading Free Course
Due to Goolge Policy We can't show the same
conent in two apps, so You have to download our
other app if you want to learn about the Technical
analysis and Scalping method.
4.Three to Five Candle Buy and Sell Method:
Buy Method:Before Knowing about the strategy
you should have 2 indicators on chart,,
SMA 20 and SMA 200. Look This is a very
powerful trading strategy on the market
bullish trend condition, There will be a bullish
market, Market will be above of 200 SMA
and in this 3 to 5 candle method, 3 to 5 Red
candle will touch the 20 SMA at first means a
short term pull back will take place in market
as shown below. You have to buy when after
3 to 5 continue red candle pullbck you will able
to see one green candle.

As we can see in the chart above those 3 red candle
Now after those we have to wait for one single green
candle as shown above and have to bought when a new
green candlewill cross the prior high of the last red candle
bar.
Sell Method:The Sell Method is Opposite of the Buy
method in this style market should be below of 200 SMA
and then you have to just wait for the 3 to 5 green candle
temporary pullback,

they will just touch the 20 SMA and
after that One Single Red Bar will come which
will give you a sell signal. This is an intraday
short term trading strategy in which you can
keep your risk and reward level 1:1 and 1:2.
I think that in Penny Stocks Its best to use this
strategy for short term goal on intra day bases.
Furthermore Trader's can Also use this strategy
in long term time frames and can hold their
trades with long run, I think its best strategy
for them to enter on right trend, right time,
etc.
5.Moving Average Trading Method:
Moving average trading method is also
one of the popular trading method in this
stock trading business. It does not matter
what kind of trading style we are adopting
its important to check every time that
what is the current market trend direction
the direction of trend can be so much helpful
to understand the future direction of the market
so that's why want to share 3 top moving average
selection to analyze the market trend wisely.
1.UPTREND:

2.DOWNTREND:

There are a lot of trader's who love moving average
but many of them don't have a good idea that which
setting will be best to analyze the trend, Since 4,5
years I am working with the 3 moving averages in
my trading system, those are SMA 8,SMA 20 and SMA
200. So I would suggest trader's to go with these three
when are looking forward to use moving average indicator.
As we can see in above chart that when market trend have
a very powerful strength in bullish and bearish trend
that which kind of market picture we able to see with
the setting of these 3 indicators. Its very easy to check
a bullish and bearish short term trend with these 3
indicators, you can take the advantage of short term
strength and can earn good money consistently in
day trading concept.Furthermore I would suggest
traders to validate your signals at first and use
all of our trading tactics in your trading strategy
combine them and build a best one for you. We
should have at least 2 to 3 solid confirmation of
buying and selling so that we can validate our
trading signals effectively.
6.JUMBO BAR METHOD:
Do you know how many trader's know about this
method?
According to my experience only a few percentage
of trader's know abou the Jumo Bar Trading method.
Now first of all you should know that what is a
Jumbo Candlestick..
A Jumo Bar is a very big size candlestick which
give you a very good knowledge of market
prediction. You can judge the market bullish and
bearish trend very easily with the help of Jumbo
bar method. And it can also help you to build an
day trading method in penny stock market to gain
some amount of consistent money regularly in
penny stocks.
BULLISH JUMBO BAR:

BEARISH JUMBO BAR:

BULLISH JUMBO BAR BUY METHOD:
Bullish Jumbo Bar Buy method is related to
the market bullish trend, in this method we
have to just wait for the bullish jumbo bar
trading signal. Along with it its important to
know that how we have to use this in igniting
time. Igniting time is one of the best time to
use bullish jumbo bar signal, And when there
will be an exhausting period time then it can
be a trade closing time for us. Some trader's start
to buy on Exhausting time which is not good
actually.

I have heard that big market players and big
financial institution make those big jumbo
candlesticks in stock trading market. As
we can see in the chart that after that first
Jumbo Bar buy signal we can wait for a pull
back in the market and can buy in the flag
pattern, or the second way would be to wait
for the one single red bar signal. We can also
see in the chart that market is making a higher
high and higher low during the Jumbo bar
signal which can be an extra confirmation of
buying for us .
BEARISH JUMBO BAR METHOD:
We have discussed about the Bullish jumbo
bar method earlier and this is the bearish
jumbo bar trading method which will be
inverse of bullish jumbo bar method. There
was concentrating on the Green bullish
jumbo bar and here in bearish method we
have to just concentrate on the big giant
bearish jumbo bar candlesticks. as shown
below in the picture.

We can see the continue 3,4 Red candles
which are also a form of jumbo bar
candle, here we have done the same
waited for the pullback first, and then
we can see a sell opportunity there with
one single red bar concept .as we have
shown in the image that when the market
price will cut the lower point of the one
green candle then we have to sell in the
market.
7.Twin Tower Trading Method:
Twin tower trading method is also
so much profitable in short term trading
and can be one of the effective way of
making money in penny stocks. Actually
The twin tower trading style is also related
to the concept of bigger candle that's why
I have given its a name of Twin Tower
trading Method.
Bullish Twin Tower
Buy Confarmation:

As we can see in the chart After a
Heavy sell or short term bearish
market we able to see this kind of
bullish pattern which is called a
twin tower bullish pattern. After
a heavy sell market we able to see
that buyers are in control now and
the sellers also start to buy in the
market to cover their loss so where
we got the double strength in market
This is also related to the big players
and big financial instituations game.
For buying we have to just wait for the
passing of that big red candle, when the
green candle will pass that higher area of
that bigger candle then it will be a buy
signal for us.Stop loss will be below of
that red candle.
BEARISH TWIN TOWER
SELL CONFIRMATION:

This is a bearish twin tower sell signal
where we pay attention on reversal trading
areas, in this chart you can see that market
was bulish at first was above of 200 sma
but what happenend later a big red bar crossed
the big green bar, which confirmed that twin
tower sell setup here. Most these come into
play when we have a big bullish movement
already in current market, most of trader's think
that market will go more up but we able to see
this kind of pattern and see a powerful bearish
movement from up their. But make sure that you
are using in short term trading strategy. I don't
have much experience with it in long term time
frames.
More Coming Soon:
Bar Trading Method:
Hello Friends, This is one of my favorite trading
method in which we just concentrate on one single
red bar to buy and one single green bar to sell.
Actually Candlestick Chart is one of the best way
to analyze the market with price action, There are
so many popular candlesticks which can make it
easier for you to understand the next movement of
the market price in future. Now I would like to
discuss that what is actually the meaning of one
single red bar and one single green bar in this
trading concept.
(a).ONE SINGLE RED BAR BUY SIGNAL:
So Guys this is one Single Red Bar trading
method where we have to just focus on the
red candle after few greens or one single green
here its important to know in this style that
market should be above of 200 Simple
Moving Average(SMA) Indicator. If you
are looking for the scalping then your risk
Risk & Reward will be 1:1 and if you are looking
for more profit then you can look forward to use a
risk & reward of 1:3 and more. Personally I am using
this style in 5 minute chart time frame but if you
are a long term trader then this strategy can be best
in h4 and daily chart time frame also.The stop loss
will be used below of our red candle as shown in
image above.
(b).ONE SINGLE GREEN BAR BUY SIGNAL:
One Single Green bar method is best for the selling
time its a strategy which is suitable for selling market
when there is a bearish trend running in stock market.
Here market should be below of 200 SMA

and One single Green Bar should be cut down from one
single Red bar in this method. The risk and reward will
be same 1:1 in scalping and in long term trading method
we can concentrate on 1:3,1:4 and so on. Here Stop loss
Above of Green Bar, or we can adjust that according to
our risk and reward setting.
2.Technical Analysis & 3 Scalping: We have already
discussed about these methods in our Other app
You can download that app direct from Google Play
Console account named Day Trading Free Course
Due to Goolge Policy We can't show the same
conent in two apps, so You have to download our
other app if you want to learn about the Technical
analysis and Scalping method.
4.Three to Five Candle Buy and Sell Method:
Buy Method:Before Knowing about the strategy
you should have 2 indicators on chart,,
SMA 20 and SMA 200. Look This is a very
powerful trading strategy on the market
bullish trend condition, There will be a bullish
market, Market will be above of 200 SMA
and in this 3 to 5 candle method, 3 to 5 Red
candle will touch the 20 SMA at first means a
short term pull back will take place in market
as shown below. You have to buy when after
3 to 5 continue red candle pullbck you will able
to see one green candle.
As we can see in the chart above those 3 red candle
Now after those we have to wait for one single green
candle as shown above and have to bought when a new
green candlewill cross the prior high of the last red candle
bar.
Sell Method:The Sell Method is Opposite of the Buy
method in this style market should be below of 200 SMA
and then you have to just wait for the 3 to 5 green candle
temporary pullback,
they will just touch the 20 SMA and
after that One Single Red Bar will come which
will give you a sell signal. This is an intraday
short term trading strategy in which you can
keep your risk and reward level 1:1 and 1:2.
I think that in Penny Stocks Its best to use this
strategy for short term goal on intra day bases.
Furthermore Trader's can Also use this strategy
in long term time frames and can hold their
trades with long run, I think its best strategy
for them to enter on right trend, right time,
etc.
5.Moving Average Trading Method:
Moving average trading method is also
one of the popular trading method in this
stock trading business. It does not matter
what kind of trading style we are adopting
its important to check every time that
what is the current market trend direction
the direction of trend can be so much helpful
to understand the future direction of the market
so that's why want to share 3 top moving average
selection to analyze the market trend wisely.
1.UPTREND:

2.DOWNTREND:
There are a lot of trader's who love moving average
but many of them don't have a good idea that which
setting will be best to analyze the trend, Since 4,5
years I am working with the 3 moving averages in
my trading system, those are SMA 8,SMA 20 and SMA
200. So I would suggest trader's to go with these three
when are looking forward to use moving average indicator.
As we can see in above chart that when market trend have
a very powerful strength in bullish and bearish trend
that which kind of market picture we able to see with
the setting of these 3 indicators. Its very easy to check
a bullish and bearish short term trend with these 3
indicators, you can take the advantage of short term
strength and can earn good money consistently in
day trading concept.Furthermore I would suggest
traders to validate your signals at first and use
all of our trading tactics in your trading strategy
combine them and build a best one for you. We
should have at least 2 to 3 solid confirmation of
buying and selling so that we can validate our
trading signals effectively.
6.JUMBO BAR METHOD:
Do you know how many trader's know about this
method?
According to my experience only a few percentage
of trader's know abou the Jumo Bar Trading method.
Now first of all you should know that what is a
Jumbo Candlestick..
A Jumo Bar is a very big size candlestick which
give you a very good knowledge of market
prediction. You can judge the market bullish and
bearish trend very easily with the help of Jumbo
bar method. And it can also help you to build an
day trading method in penny stock market to gain
some amount of consistent money regularly in
penny stocks.
BULLISH JUMBO BAR:
BEARISH JUMBO BAR:
BULLISH JUMBO BAR BUY METHOD:
Bullish Jumbo Bar Buy method is related to
the market bullish trend, in this method we
have to just wait for the bullish jumbo bar
trading signal. Along with it its important to
know that how we have to use this in igniting
time. Igniting time is one of the best time to
use bullish jumbo bar signal, And when there
will be an exhausting period time then it can
be a trade closing time for us. Some trader's start
to buy on Exhausting time which is not good
actually.

I have heard that big market players and big
financial institution make those big jumbo
candlesticks in stock trading market. As
we can see in the chart that after that first
Jumbo Bar buy signal we can wait for a pull
back in the market and can buy in the flag
pattern, or the second way would be to wait
for the one single red bar signal. We can also
see in the chart that market is making a higher
high and higher low during the Jumbo bar
signal which can be an extra confirmation of
buying for us .
BEARISH JUMBO BAR METHOD:
We have discussed about the Bullish jumbo
bar method earlier and this is the bearish
jumbo bar trading method which will be
inverse of bullish jumbo bar method. There
was concentrating on the Green bullish
jumbo bar and here in bearish method we
have to just concentrate on the big giant
bearish jumbo bar candlesticks. as shown
below in the picture.

We can see the continue 3,4 Red candles
which are also a form of jumbo bar
candle, here we have done the same
waited for the pullback first, and then
we can see a sell opportunity there with
one single red bar concept .as we have
shown in the image that when the market
price will cut the lower point of the one
green candle then we have to sell in the
market.
7.Twin Tower Trading Method:
Twin tower trading method is also
so much profitable in short term trading
and can be one of the effective way of
making money in penny stocks. Actually
The twin tower trading style is also related
to the concept of bigger candle that's why
I have given its a name of Twin Tower
trading Method.
Bullish Twin Tower
Buy Confarmation:

As we can see in the chart After a
Heavy sell or short term bearish
market we able to see this kind of
bullish pattern which is called a
twin tower bullish pattern. After
a heavy sell market we able to see
that buyers are in control now and
the sellers also start to buy in the
market to cover their loss so where
we got the double strength in market
This is also related to the big players
and big financial instituations game.
For buying we have to just wait for the
passing of that big red candle, when the
green candle will pass that higher area of
that bigger candle then it will be a buy
signal for us.Stop loss will be below of
that red candle.
BEARISH TWIN TOWER
SELL CONFIRMATION:
This is a bearish twin tower sell signal
where we pay attention on reversal trading
areas, in this chart you can see that market
was bulish at first was above of 200 sma
but what happenend later a big red bar crossed
the big green bar, which confirmed that twin
tower sell setup here. Most these come into
play when we have a big bullish movement
already in current market, most of trader's think
that market will go more up but we able to see
this kind of pattern and see a powerful bearish
movement from up their. But make sure that you
are using in short term trading strategy. I don't
have much experience with it in long term time
frames.
More Coming Soon:
No comments:
Post a Comment